Showing posts with label GIS. Show all posts

Saturday, January 28, 2012

NSF-REU 2012: Geospatial Research on Kauai

http://www.csulb.edu/colleges/cla/departments/geography/nsf-reu/

Anthropology and Geography undergraduates -- as well as others interested in the study of landscapes-- may be interested in a new summer field program on geospatial research and mapping (GRAM) that will take place at the National Tropical Botanical Gardens (NTBG) on Kauai this summer.  This field research program is a joint effort between faculty in the Department of Geography and Anthropology at CSULB and is focused on the use of cutting edge geospatial techniques (e.g., satellite and aerial imagery, the use of UAVs, geographic information systems, spectral analyses, topography generation, landscape analyses, near surface remote sensing, etc.  The research being undertaken by GRAM includes the study of prehistoric landscapes as well as contemporary resources and environments. A website is now operational (http://www.csulb.edu/colleges/cla/departments/geography/nsf-reu/)  that describes the program and includes an application form, details about the the NTBG and so on. This field training course is funded for 3 years via the National Science Foundation (NSF) under their Research Experience for Undergraduates (REU) program.
This year's GRAM project will take place June 11 to July 7 and include training in Long Beach and the National Tropical Botanical Gardens in Kauai. The NSF-REU program provides funding for student to cover travel, housing, tuition costs as well as a small stipend. Applications are competitive and open to undergraduates across the country. Note that students must be enrolled as undergraduates in order to meet the requirements of the REU program -- graduated seniors are not eligible per NSF rules.


For information about the program, the application, schedule, etc, please see:

http://www.csulb.edu/colleges/cla/departments/geography/nsf-reu/

or contact me.
Cheers,
CPL

Carl Lipo, Professor
Department of Anthropology and IIRMES
California State University Long Beach
1250 Bellflower Blvd.
Long Beach, CA  90840

Ph: 562-985-2393
Fx: 562-985-5179
Email:  clipo@csulb.edu
Blog:  http://www.evobeach.com
Web:  http://www.lipolab.org

Tuesday, November 30, 2010

Open Source GIS

If you haven't tried it lately, I recommend you give GRASS a whirl. While earlier versions were a mess of imploding modules and inscrutable dialogs, Version 6.4 has many binaries for the major platforms and lots of deep functionality. Check it out at: http://grass.fbk.eu/Mac OS X binaries are available at: http://www.kyngchaos.com/software/grass (just needs GDAL, Freetype and cairo frameworks to install -- links on the KingChaos site).

You also should check out the newest version of Quantum GIS (QGIS). The latest release (1.6.0) is "Copiapó" is getting to be pretty solid. http://www.qgis.org/  

While you are at it, download the newest version of Google Earth (6.0) which now boasts 3D trees. Im not sure why we need 3D trees but what the heck. Actually, the better integration of historical imagery makes this a very useful release.

Friday, November 12, 2010

Structure From Motion

Part of our interest in acquiring a UAV is to expand our ability for quickly generating high resolution topographic data. Traditionally, this process is time-consuming and (as a result) expensive. I've spent a number of summers collecting elevation data over archaeological deposits (Easter Island, Panakton, Greece, Harappa..) and even after weeks of tedious point collection (and thousands of points measured across the ground), the resulting topographic map is less-than-desirable. The problem is one of data density -- 1000 points can be collected pretty quickly (esp. with a modern total station) but over any sized area the density of the points is pretty low per unit area. Take a 100x100 meter area -- it would take 10000 points to have a point every meter. 1000 points is only a 10% sample of that. Now one can be "smart" and sample more densely in areas with greater changes in topography but then some of the algorithms for building the iso-contours will produce odd "artifacts" -- many assume even coverage of points. Even with 10000 points, you end up with a fairly crude representation of the surface - which might work at the scale of the entire deposit, but is too crude for examining any specific area. To make matters worse, in order to increase resolution by say 2x (i.e., to get 50 centimeter resolution), you have to quadruple the sample size.

New developments in laser scanning and LiDAR provide a great means for changing the data generation to cost relationship. However, the technology is pretty new and not entirely cheap. Ultimately, LiDAR provides a great solution for mapping landscape scale features (e.g., entire states) and produces information about the bare ground (so can provide topographic data under tree canopies -- often where we know the least about the archaeological record [e.g., bayous]). But for a project specific survey LiDAR can be overly expensive or simply impossible (since getting plane to some places with the right set up for laser scanning is not always possible -- e.g., Easter Island). Here, land-based laser scanners are handy but these cost about $100,000 to start and typically require trained operators. Renting them can be as much as $20K a month.

From a cost perspective, generating topographic information using "structure from motion" based techniques is quite appealing. This approach makes use of basic imagery collected from inexpensive cameras. Surfaces are calculated based on shared points in photos, determining the position of the camera from images and calculating where the points that are shared must be in space in order that they were captured by the camera. It is an ingenious technique - using some cool math. Noah Snavely, a PhD student (now an assistant professor at Cornell) at the University of Washington developed some of the basic software for doing this (originally part of a "photo tourism" project in which photos taken by tourists of locations can be combined to build a 3-D model of the scene - without knowing before hand where the cameras were placed and under a variety of lighting and other conditions). This project has morphed into Photosynth, the free Microsoft project that automates this project and is Silverlight based.

From a topographic perspective, the "structure from motion" approach is pretty slick - using just a bunch of photos made on cheap digital cameras, one can produce detailed representations of surfaces. Actually, the product is a 3D point cloud that has excellent relative accuracy. Increasing resolution simply means more photos - and whole swaths of areas can be covered with just a click of the shutter. Getting absolute position requires georectification - a separate process (which I can detail elsewhere). Commercial products, though, can take geotagged photos and create a georeferenced point cloud. We have a license for Microsoft's Geosynth - a professional version of Photosynth that can take HD video and geotags to produce high density georeferenced point clouds.

One of the problems with Geosynth, however, is that it doesn't produce some basic products such as a simple (georeferenced) photomosaic. Instead, there focus is on creating "synths" -- a cool product but entirely unintegrated with other kinds of spatial tools (e.g., GIS). Last week, we saw a demo of another software package that produces mosaics using the same kinds of algorithms as Geosynth -- 2d3's TacitView. 2d3 is a small software company located in Irvine. TacitView (and TopoMap, their 3D product). The software is slick and well-done - a great interface and the products are well-suited for integrating into GIS software. We are going to do a demo of this software soon to see how it compares to Geosynth.

Thursday, December 10, 2009

A Practical Guide to Geostastical Mapping

Just saw this and thought I'd pass it on:

200912101753.jpg

Tomislav Hengl has just released has new book, A Practical Guide to Geostatistical Mapping over at http://spatial-analyst.net/book/. The book is available for free browsing online and as a free PDF download, or you can order a printed copy. The book is made up of lecture material for a PHD course teaching spatial analysis using open source software. All the datasets used in the book are available at the homepage as well." Download the PDF here Interestingly, you can improve the book interactively by using an iPaper application that is part of the www.scribd.com browser. Cool idea.

From the webpage:

Geostatistical mapping can be defined as analytical production of maps by using field observations, auxiliary information and a computer program that generates predictions. The purpose of this guide is to assist you in producing quality maps by using fully-operational open source software packages: R+gstat/geoR and SAGA GIS. Materials presented in this book have been used for the five-day advanced training course "GEOSTAT: spatio-temporal data analysis with R+SAGA+Google Earth" that is periodically organized by the author and collaborators. This is an open access publication!

Monday, September 28, 2009

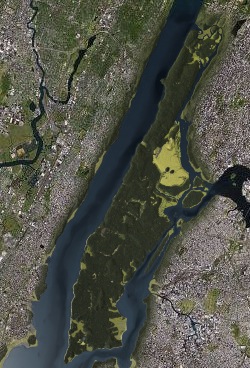
Mannahatta: Manhattan of AD 1609

I've always been intrigued by the way in which past landscapes structure contemporary ones -- and how we can use our knowledge of shape of landscapes to explain why the environment we see today is the way it is. Cities are particularly interesting in this regard. The natural landscape often constrains and shapes the evolution of urban development and dictates the kinds of things that humans must cope with in order to do the business of being urban (i.e., transforming swamps to land, crossing rivers, knocking out hills, etc.). Perhaps the evidence of this interaction is nowhere better seen than in the shape and structure of Manhattan. The city has been so massively developed that one might think that isn't one shred of "natural" in the streets and buildings. Yet, that's not entirely true since the history of the growth of the city has had to embrace the natural features that long preceded Europeans -- streams, marshes, hills, geology, etc. Canal Street really was a canal at one point, built on top of a stream/wetland. Wall Street really is the site of an early historic wall, placed on a topographic high point when the island boasted a fort. And so on. An understanding of natural and historical world is required to understand Manhattan, as detailed in the amazing, insanely detailed, massive, chest crushing, Pulitzer Prize winning book "Gotham" by Burrows and Wallace.

Recently, the Wildlife Conservation Society has put together Mannahatta, a website dedicated to providing a way of understanding the natural heart of the island of Manhattan. It is pretty impressive. At the heart of the project is an interactive map of that shows the island as it was in AD 1609. The map allows you to look at a specific location and see where it stood in the Native American inhabited landscape of the early 17th century just prior to the arrival of Henry Hudson and other Europeans.


200909281525.jpg

Thursday, January 15, 2009

Geography, Archaeology and the iPhone

In many ways, the 3G version of the iPhone has the potential to be a great little device for field data collection. The iPhone boasts a GPS, a digital camera a great buttonless interface, sharp graphics, integration with Google Earth and a remarkable programming SDK. Yeah, there are downsides: the precision of the GPS is probably ca. 5 meters at best, the camera CCD "only" 2 megapixels, the SDK is available only through a developers program, the 3G data plan will bankrupt most people if used internationally in "data roaming" mode. But compared with the expensive, heft and "special purpose" nature of most professional gps/data collectors - the iPhone is kind of the ultimate in tiny, ubiquitous, multi-functional and inexpensive field device since one can:

- take geotagged photos of landscapes/artifacts/objects

- record notes for positions through a host of applications.

- locate oneself on satellite imagery and aerial photography - live and in the field!

- perform functions such as calculate slope, measure remote heights through 3rd-party apps

- potentially develop specialized GIS field data collection apps using the SDK (which has a SQL dimension) in which one can photograph features, record positions and describe things using a pre-set data dictionary.

- not to mention it's a phone.

I think that some of the potential for the iPhone is just beginning to emerge as developers find out about the possibilities of this platform and GIS users realize what they have in their pockets. As it stands there are a number of good applications that point in the direction that the iPhone platform can go in terms of GIS functions. For reference sake here are a list of apps that I have come across to date. There are many others - if you have any good ones, let me know.

- Google Earth (of course). This iphone app makes viewing and collecting points on real-time imagery possible.

- TrackMe a 99 cent app that is great for mapping linear features and tracks.

- iPhone Maps - this is a built-in application but is fairly useful for plotting locations. Quite basic but functional.

- GPK Kit - This is a comerical app ($10) but a good one for turning your iPhone into a functional GPS unit with all the features you'd expect.

- SeaDragon Mobile - This Microsoft iPhone app showcases their "Deep Zoom" technology - but also hosts their Virtual Earth imagery (with GPS locations) as well as Photosynth! Whoohoo!

- Cardinal Application is good for working out direction (eg: orientation of slope, direction of flow of a river etc…)

- Clinometer Application – Slope, angle and gradient measurements on demand

- RulerPhone - lets you measure remote objects (or artifacts) by including a fixed scale in the image. With this one could measure heights of trees, mounds, or sizes of artifacts.

- Geotags - Is a basic GIS app for the iPhone. It allows you to take geotagged photographs, write notes, pinpoint features, and geotag audio recordings. This app demonstrates what will be possible for the iPhone is a basically a generic GIS data recording system.

- AirMe is a good application for automatically uploading geotagged photographs to Flickr.

Friday, April 25, 2008

Online Map Rectification!

Ah, the joys of web 2.0 and web services. This free service from metacarta.com provides an online way of rectifying and georeferencing maps. Free! Online! Too cool for words so check this out:

http://labs.metacarta.com/rectifier/

Saturday, April 19, 2008

BILKO- Image Analysis for Remote Sensing

For all of you self-starters out there, you might be interested in: http://www.noc.soton.ac.uk/bilko/ Bilko is an open source and free image analysis package for remotely sensed data (e.g., satellite images but alos other kinds of imagery). The website includes are a variety of tutorials for learning how to use the software and to conduct analyses of image data (mosaic, rectification, classification, etc). Ill probably include a module or three in my next "Archaeological Field Research Design" class provided I'll be able to teach that again. This looks like a great way of getting some hands on skills in image processing and getting some tools for doing these kinds of analyses for your own research.

Monday, April 14, 2008

Shapefile Connection - Providing Access to Public GIS Data

Shapefile connection is a nifty Google Earth Mashup that collates sources of public geodata and shapefiles. Worth a visit or two...

[ Shapefile Connection - Providing Access to Public GIS Data]

Thursday, April 3, 2008

GIS Platform - uDig

Whenever I think I have found the general set of tools for my computer that make me functional and effective, I come across another amazing bit of software out there that blows me away. This time I've stumbled onto uDig - a java based, eclipse rich GIS client. It is platform free and excellent. As they put it:

The goal of uDig is to provide a complete Java solution for desktop GIS data access, editing, and viewing. uDig aims to be:

  • User friendly, providing a familiar graphical environment for GIS users;
  • Desktop located, running as a thick client, natively on Windows, Mac OS/X and Linux;
  • Internet oriented, consuming standard (WMS, WFS, WCS) and de facto (GeoRSS, KML, tiles) geospatial web services; and,
  • GIS ready, providing the framework on which complex analytical capabilities can be built, and gradually subsuming those capabilities into the main application.

With tools like this, ESRI folks should be worried - yeah, they provide the "industry standard" but with the prices they charge they better be offering something that makes one head spin -- and on every platform!